
Investment projections are meant to help you plan, but they can also plant the wrong idea
A projection is supposed to answer a simple human question: “Am I on track?” It turns messy reality (markets, inflation, contributions, charges, retirement age, future salary) into a single line that looks reassuringly official.
And that’s a little problem.
Because once a figure from a provider is given to across many people treat it as an expectation, not an illustration. The projection starts to feel like a destination, even when the engine under the bonnet is completely unknown.
Wiseones view: a projection is can be useful as long as you understand of what is under the bonnet. If you don’t know the asset classes, you don’t really know what the projection is modelling.

The FCA-style projections: standardised, capped, and everywhere
Most online tools, new money illustrations, and “what might this be worth?” calculators live under FCA rules. These rules deliberately standardise growth rates so firms can’t make things look rosier than they should.
The headline constraint is simple:
For pensions and ISAs, growth rates are capped at 2% – 5% – 8% (low / mid / high).
For life funds / other investments, the cap is 1.5% – 4.5% – 7.5%.
The gaps are also standardised: there must be a 3% spread between low–mid and mid–high.
That is good consumer protection in one sense it stops wild marketing optimism which had been seen previously.
But it also creates a subtle behavioural trap: the projection becomes a template rather than a reflection of what the underlying assets are expected to do. Caps can prevent illustrations from reflecting what managers expect, and the standard deterministic approach can struggle to represent how investing actually behaves in the real world. It is not a savings account, it is your money being put to work in the economy.
So yes: FCA-style projections help create consistency. But consistency isn’t the same as accuracy.
The actuarial way of SMPI since 2023
If you’re in a defined contribution (money purchase) pension, you’ll usually receive an annual statement and on it will be a projection and this one is called an SMPI (Statutory Money Purchase Illustration). This is as an annual illustration of what your pension may be worth in today’s money at retirement, produced in line with FRC guidance.
Since 1 October 2023, the methodology shifted. Rather than using broad “balanced-style” assumptions, the FRC’s AS TM1 framework moved to a volatility-based approach. This groups funds by how volatile they’ve been over the previous five years and attaching a standard growth rate to that band.
From April 2024, the bands and growth rates are:
Group 1: 0–5% volatility → 2%
Group 2: 5–10% volatility → 4%
Group 3: 10–15% volatility → 6%
Group 4: >15% volatility → 7%
This is often presented as “more accurate” because it is more fund-specific.
Why the five-year volatility lens can mislead (especially after the rate hikes)
Here’s the uncomfortable truth about the post-2022 world: “safer” assets haven’t been behaving safely.
When interest rates rose quickly, bond prices fell and long-dated bonds/gilts in particular became far more volatile. That volatility then feeds directly into the SMPI framework, because SMPI classification is based on the last five years.
Vanguard’s own work on gilts illustrates the new reality: they argue gilts now offer more attractive prospective returns than many developed government bond markets, and their model expects UK gilts to deliver 5.0%–6.0% annualised return over the next ten years with 7.8% volatility (and they stress projections are hypothetical).
That’s not a “gilts are bad” story, it’s a reminder that bond returns are now being driven heavily by yields and rate expectations, and that the volatility of these assets can jump when the macro regime shifts.
And this is where the SMPI framework can produce the wrong takeaway:
A volatility spike can push a fund into a higher volatility group,
a higher volatility group can mean a higher assumed growth rate,
so a bond-heavy fund can look more “promising” in projection terms precisely because it has been bouncing around as interest rates change quickly.
That may be a perfectly defensible statistical method for short horizons. But it can be a dangerous story to tell a 30-year-old investing for 40 years.
Because short-term volatility is not the same thing as long-term wealth creation, as if you owned those bonds going into the 2022 increase in interest rates they could be still very under water. Price going down quickly increases volatility that can make a projected returns look very high.
The Vanguard 120-year message: asset mix defines your entire range of outcomes
This is why the “under the bonnet” view matters.
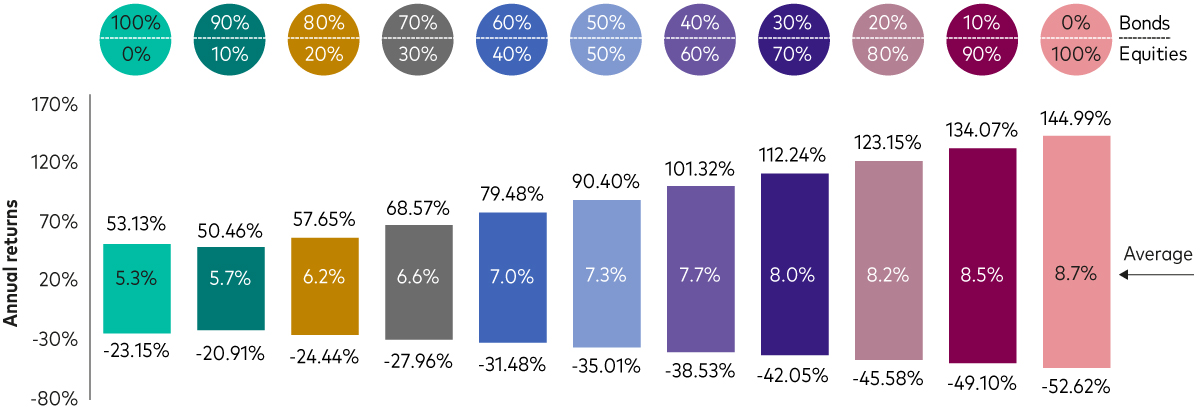
Notes: Reflects the maximum and minimum calendar year returns, along with the average annualised return, from 1901-2022, for various stock and bond allocations, rebalanced annually. Equities are represented by the DMS UK Equity Total Return Index from 1901 to 1969; thereafter, equities are represented by the MSCI UK. Bond returns are represented by the DMS UK Bond Total Return Index from 1901 – 1985; the FTSE UK Government Index from Jan 1986 – Dec 2000 and the Bloomberg Barclays Sterling Aggregate thereafter. Returns are in sterling, with income reinvested, to 31 December 2022.
Source: Vanguard.
Vanguard’s long-run diversification material is crystal clear: the mixture of assets defines the spectrum of returns, and the risk/return trade-off should be the primary consideration when setting long-term asset allocation. They show (1901–2022) that shifting the equity/bond mix changes not only average returns, but also the best and worst calendar year outcomes.
That’s what your attached chart is really saying in one picture:
as equity weight rises, the upside potential increases and so does the depth of the bad years. The range is the point.
Vanguard also makes two observations that sit awkwardly next to projection culture:
those averages are not something you should expect in any given period,
and inflation risk can quietly change a portfolio’s risk profile, which is one reason they don’t generally view cash as a meaningful long-term allocation (except for liquidity needs).
So if your projection looks “reasonable” but your assets are not, the projection isn’t helping it’s anaesthetising.
The biggest projection pitfall: you can end up in the wrong assets for decades
Here’s the scenario that should worry you:
You receive an illustration that suggests a healthy-looking outcome, you set it and like most people leave the investments until you need them. For a pension this could be a 30/40 even 50 year timeline.
You assume you’re in something broadly balanced.
But the actual investment is heavily weighted to lower-risk assets, potentially long duration, potentially rate-sensitive and you stay there for decades because the projection never forces the uncomfortable conversation.
This is not hypothetical. It’s a natural outcome of a system where:
FCA projections are capped and standardised,
SMPI projections are driven by a five-year volatility classification,
and consumers often aren’t shown a simple, honest “what you actually own” breakdown alongside the projection.
Consumer Duty only sharpens the edge of this: if projections create a false sense of understanding, the “consumer understanding” outcome is not being met in spirit even if the numbers are technically compliant.
Wiseones bottom line: projections are a prompt not a plan
Use projections for what they’re good at: a nudge to review your savings rate and retirement assumptions.
But never let a projection substitute for answering the real questions:
What asset classes am I in today?
What is the driving force behind returns in those assets? (growth, yield, credit risk, interest-rate sensitivity, inflation linkage, currency, etc.)
Is a five-year volatility snapshot a sensible lens for my horizon or would a longer, index-based view be a better anchor?
Because if you’re 25 with a 40-year runway, your outcome will be shaped far more by strategic asset allocation than by whether your fund’s last five years were calm or chaotic.
Very useful advice