
This might sound obvious to some people.
For others, it’s something that’s never really been explained, despite years of paying into a pension or ISA.
Many people know they have a fund.
Far fewer know what that fund actually owns, how it’s managed, or why it behaves the way it does.
And that gap in understanding is where a lot of unnecessary worry and poor decisions tend to creep in.
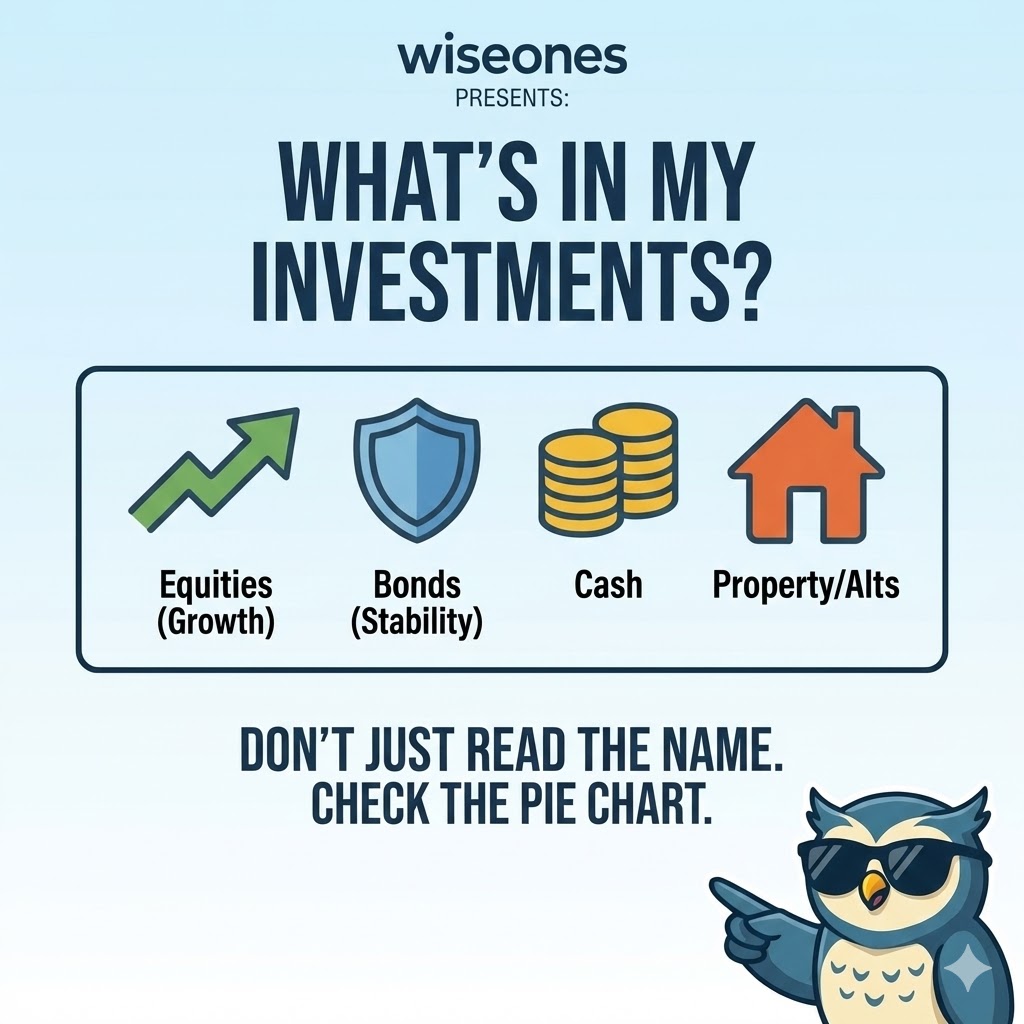
First things first: where do I see what I’m invested in?
If you log in to your pension or ISA platform, you’ll usually find a section called something like:
Asset allocation
Fund breakdown
Holdings
If it’s not obvious, searching the fund name online will normally show it.
What you’ll often see is a pie chart showing how your money is split between different asset types: equities, bonds, cash, property, gilts, and others alongside a list of the top holdings. You should also see a performance chart or tables of performance.
That Pie Chart is far more important than the fund name, which for many tells you nothing. It tells you what your money is actually invested in at that moment.
A quick note on language
I’ll use the word “fund” throughout.
But the same principles apply whether you:
Own individual shares
Hold bonds directly
Invest through a pension, ISA, or platform
At its core, every investment is simply a mix of assets, each playing a different role.
What are these markets?
People often say “my pension’s in the market” as if it’s one place, moving up and down as a single thing.
But it isn’t.
Your pension isn’t parked in one market, one country, or one type of investment. It’s spread across different assets and different regions, all behaving differently at different times.
That’s why your pension doesn’t always move in line with the headlines.
If the US stock market falls sharply, your pension might fall less or not at all because other parts of the portfolio are doing something different. Equally, if one market is flying, your pension won’t always capture all of that upside, because it isn’t designed to rely on any single outcome.
Your investments aren’t “in the market”.
It’s built across markets, deliberately.
Equities: usually the biggest slice
For most people still building wealth, the largest slice of the pie will be equities.
Equities, shares, and stocks all mean the same thing: owning part of a company.
When you own equities:
You may receive dividends (a share of profits as long as they have them)
The value of your investment can rise as the company grows and becomes more valuable so others want to buy it. This competition can increase the price over time as more people are competing from a limited number of parts of the company.
Historically, equities have delivered the strongest long-term returns but they also come with volatility. Prices move around, sometimes uncomfortably so. This is why it is called a higher risk asset, that’s not a bad thing for most of the time when growing your investments.
That volatility isn’t a flaw. It’s the price paid for long-term growth.
Bonds: lending instead of owning
If equities are about ownership, bonds are about lending.
When you invest in bonds, you’re lending money to:
Governments
Companies
Financial institutions
In return, you receive:
Regular interest payments
Your capital back at maturity (assuming no default)
Bonds generally deliver lower returns than equities because they’re lower risk. Bondholders are paid before shareholders if something goes wrong, which limits losses but also limits upside. There are also savings bonds which are a high interest savings account and not an investment.
That’s why bonds are often used to:
Reduce overall volatility
Provide income
Can act as a stabiliser when equities struggle (some of the time)
Government bonds (Gilts): the reference point
In the UK, government bonds are known as Gilts.
They’re often referred to as the UK risk-free rate not because prices don’t move, but because the likelihood of the UK government failing to pay is extremely low and all other investments are priced from this on whether it is worthwhile or not.
Gilts matter because:
Interest rates are built around them
Other assets are priced relative to them
They play a key role in retirement portfolios, especially later in life
Diversification isn’t about guarantees. It’s about improving outcomes over time, not eliminating risk altogether.
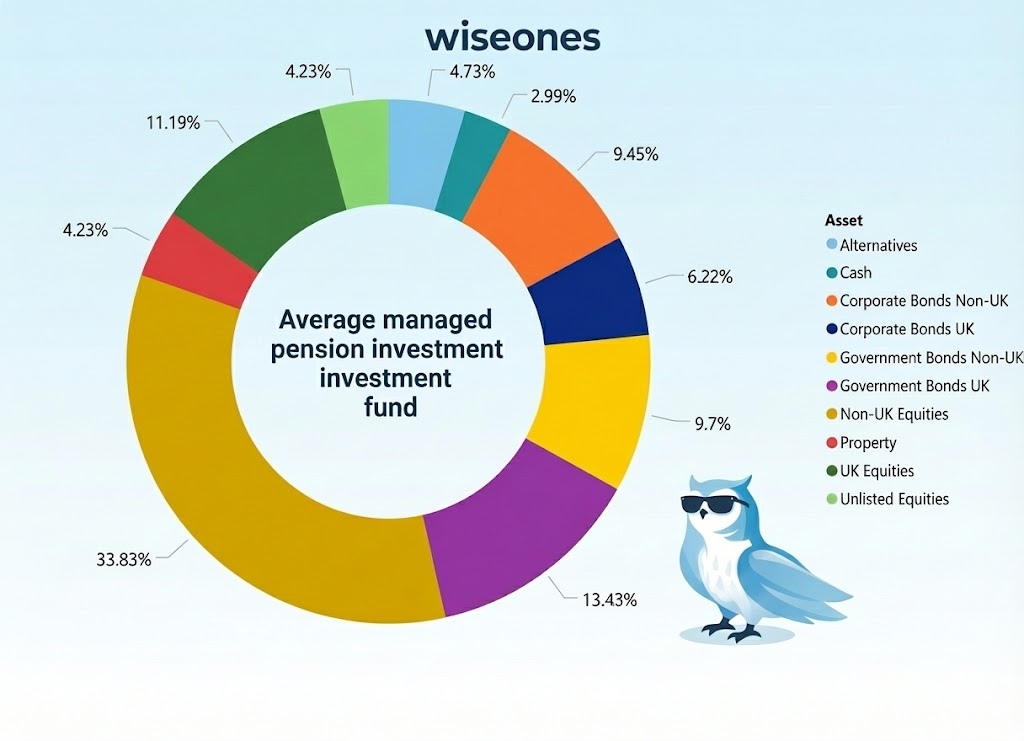
The “other assets” you’ll often see
Most diversified funds don’t stop at equities and bonds.
Property
Usually commercial property — offices, warehouses, supermarkets — providing income and diversification.
Cash
Cash won’t drive long-term growth, but it reduces volatility and provides flexibility during uncertain periods.
Absolute return and alternative strategies
Designed to deliver steadier returns across different market conditions, though results can vary.
Private assets and LTAFs
Including infrastructure and private equity. LTAFs (Long-Term Asset Funds) are increasingly used in pensions to access long-term projects that aren’t traded daily on stock markets.
These assets tend to be smaller slices as they are less flexible investments, but they add resilience.
It’s not just what you invest in — it’s where
Your investments are also spread across different regions.
This means you’re not relying on:
One country
One economy
One stock market always leading
Markets rotate. Leadership changes.
In 2025, for example when priced in £s:
The UK stock market (FTSE 100) returned approximately 21%
The US top 500 companies returned closer to 9%
Global equity trackers returned just over 10%
Yet many investors were still heavily weighted toward the US, simply because that’s what had worked for the previous two decades.
That doesn’t mean the UK will lead again.
It doesn’t mean the US won’t.
It simply reinforces one truth: markets move & change.
Passive & Active management and rebalancing
Many funds that aren’t simple index trackers are managed even if they are called passive managed funds, they can adjust them. (This is quite a detailed are into Active & Passive, we will put out a separate piece in February on this)
That means the fund manager can periodically:
Rebalances the asset mix
Adjusts regional exposure
Trims areas that have grown strongly
Adds to areas that have lagged
Some funds rebalance monthly, others quarterly or annually. Some do it more dynamically.
This isn’t about predicting the future perfectly. It’s about asking sensible “what if?” questions and keeping risk aligned with the fund’s objective.
Lifestyling and derisking (briefly)
As retirement approaches, many pensions gradually reduce risk automatically — a process often called:
Lifestyling
Derisking
A glidepath
This usually involves reducing equities and increasing bonds, gilts, and cash. The aim shifts from maximising growth to protecting what you’ve built.
This is a subject worth understanding properly and not assuming one default approach works for everyone at a specific age.
Why long-term performance tells the real story
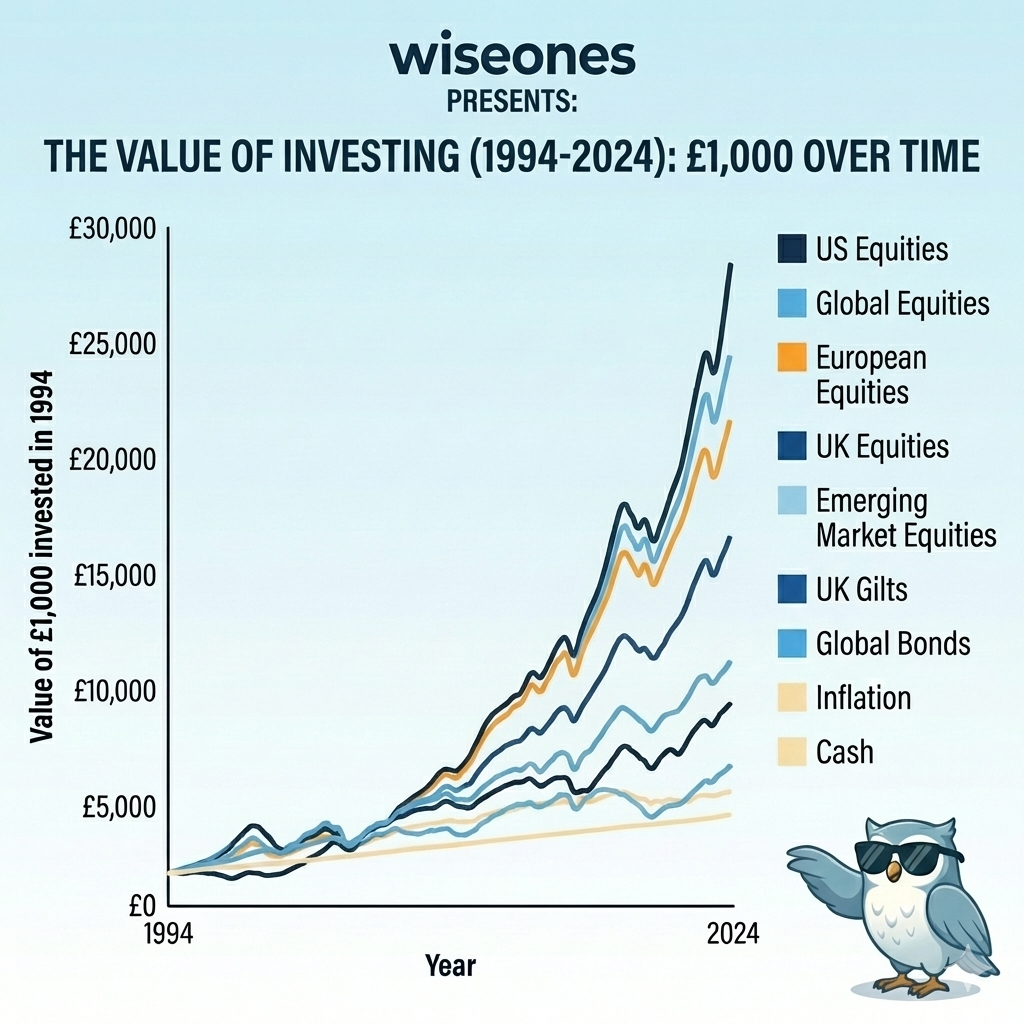
Long-term charts like the performance graphic above put all of this into perspective.
(This isn’t an exact chart; it’s a visual illustration, but the trends and end points are taken from real historical data.)
Over decades:
Equities have outpaced inflation, bonds, and cash
Bonds have beaten cash but lagged equities
Different regions have taken turns leading
Before 1990, the picture looked very different again.
History doesn’t repeat — but it does rhyme. And it consistently reminds us why diversification and flexibility matter.
The real force behind long-term investing: compounding
“Compound interest is the eighth wonder of the world.
He who understands it, earns it; he who doesn’t, pays it.”
— Albert Einstein*
*Whether he actually said it or not almost doesn’t matter, his name adds a little gravitas. The message is absolutely right.
The reason equities tend to win over long periods is simple: ownership compounds.
When you own a growing business, your piece of that business grows as profits are reinvested and value builds on itself. That growth then feeds further growth.
Bonds work differently. You’re lending money and being repaid. Even if you reinvest the interest, you often do so at different future rates, which limits how much compounding can occur.
That difference growth versus repayment is why equities dominate long-term charts, while bonds provide stability rather than long-term growth.
Why this matters more than returns in any single year
The long-term charts aren’t impressive because of one great year.
They’re impressive because they show what happens when:
You stay invested
You allow different assets and regions to take turns leading
You don’t interrupt the process
Chasing performance, reacting to headlines, or jumping in and out of markets doesn’t just add stress,it breaks compounding.
And once compounding is broken, it’s very hard to recover what was lost.
Invest. Stay invested. Let time do the work.
You don’t need perfect timing.
You don’t need constant action.
You don’t need to be right every year.
You need:
A sensible, diversified portfolio
Enough time
And the discipline to let compounding work
That’s how long-term investing actually delivers results.
Invest. Stay invested. Let compounding do the heavy lifting.
The Wiseones view
Your long term investments aren’t a black box.
It should be a deliberately constructed mix of:
Asset classes
Regions
Strategies
Each chosen for a reason, rebalanced over time, and adjusted as markets and your life changes.
Understanding what you’re invested in turns uncertainty into a little bit of knowledge and that’s one of the most valuable returns your investments can give you.